Product designers, product managers and founders building AI products whose interfaces show a lot of data - model outputs, confidence, configuration and history - to professional users.
- Data-heavy AI interfaces usually fail from information overload and unclear trust signals, not from a lack of visual polish.
- Settle the information architecture first: what users need now, what they can ask for, and what never belongs on the main screen.
- Progressive disclosure - summary first, detail on demand - is the core pattern, because the underlying data volume genuinely is high.
- Design for calibrated trust. Only 46% of people globally are willing to trust AI systems, and many rely on AI output without checking it. Show sources, confidence and a way to verify.
- Give charts and data their own tested colour layer, separate from brand accents, and never rely on colour alone.
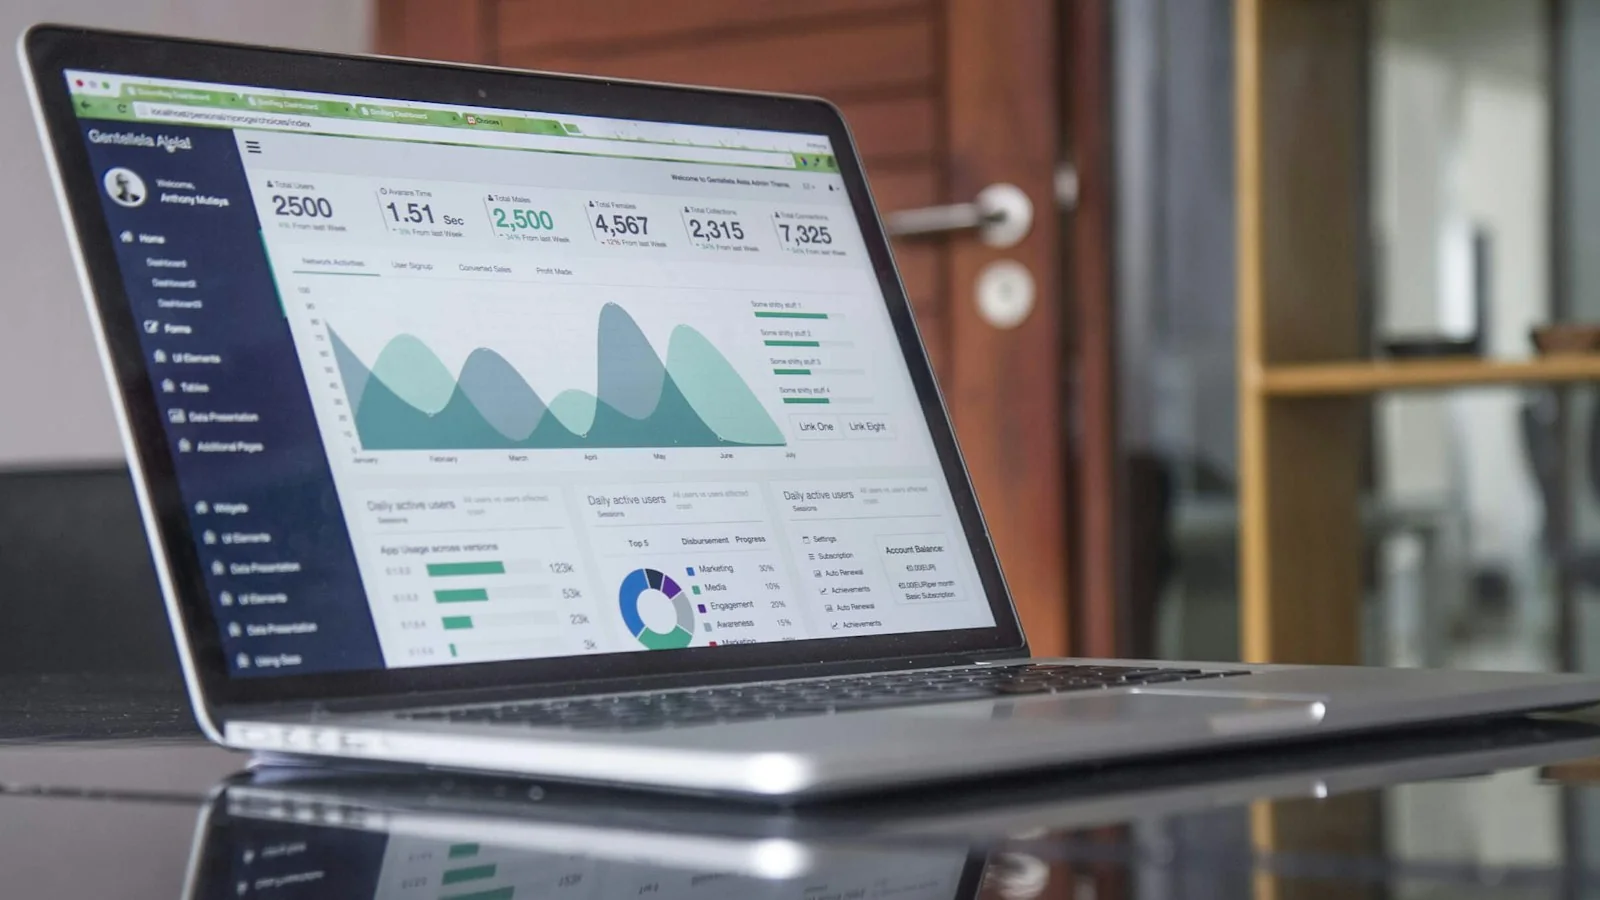
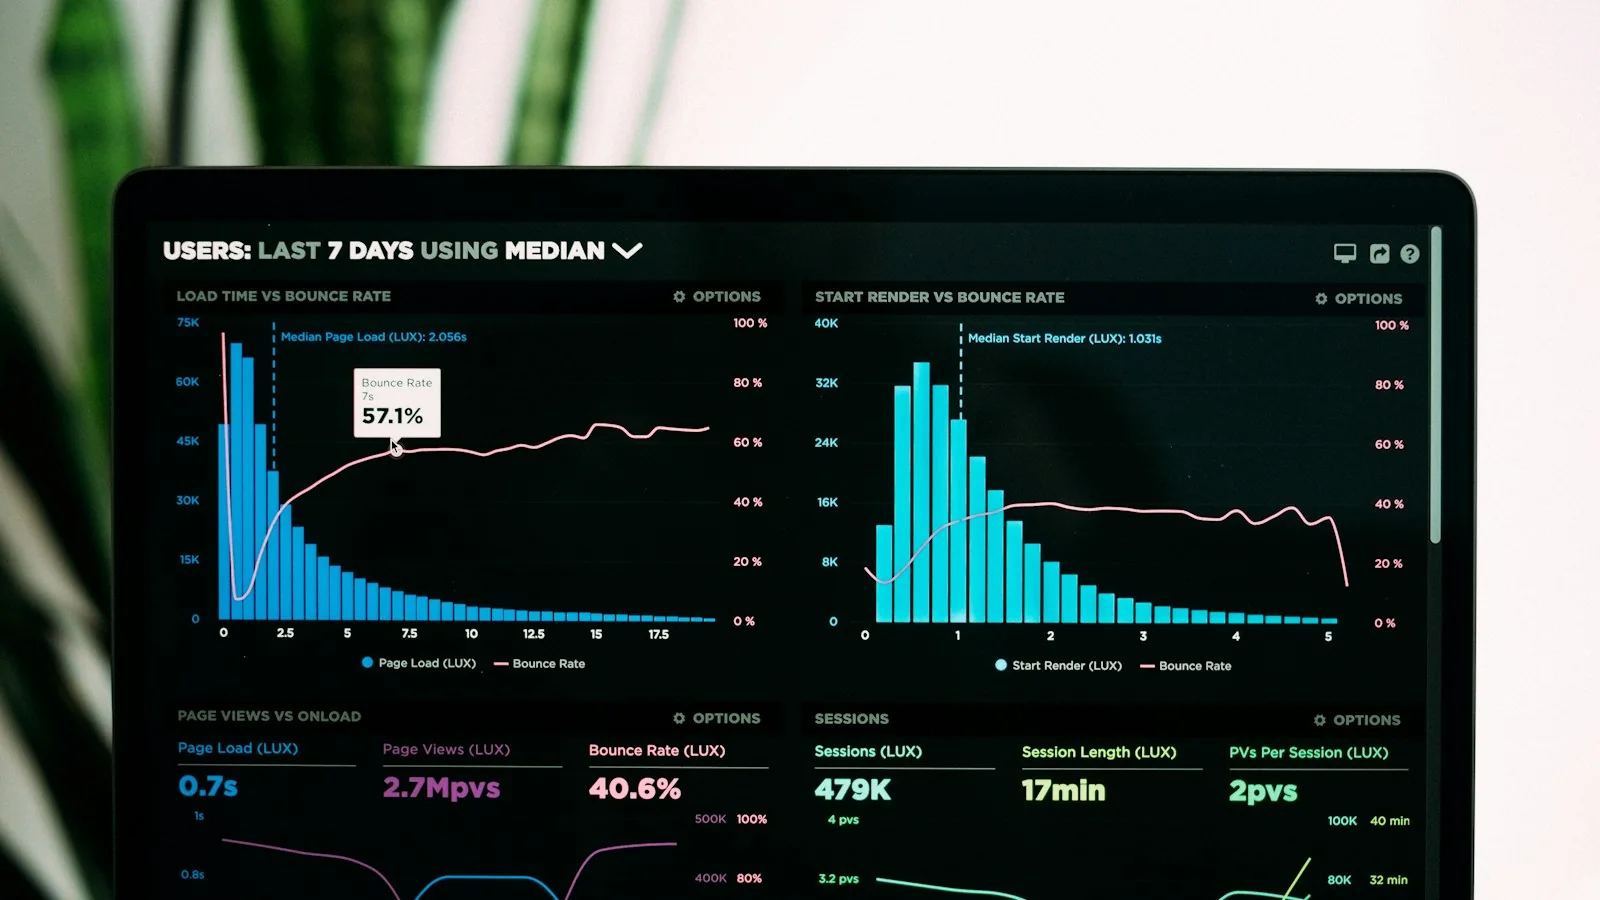
AI product interfaces face a problem most consumer apps never do: there is genuinely a lot the user might need - model outputs, confidence indicators, sources, configuration, history, comparisons, audit logs. The instinct is to expose all of it, as directly as possible, in the name of transparency. That instinct usually produces screens that are technically complete and practically unusable.
The interfaces that work hide complexity by default and reveal it on demand. This article sets out the patterns that make that possible, with particular attention to trust - the thing AI interfaces most often get wrong.
The trust problem is a design problem
People's relationship with AI is ambivalent. The 2025 KPMG and University of Melbourne global study of more than 48,000 people found that while 66% use AI regularly, only 46% are willing to trust AI systems - and 66% said they had relied on AI output without evaluating its accuracy, while 56% had made mistakes in their work because of AI. Among developers, Stack Overflow's 2025 survey found more respondents actively distrust the accuracy of AI tools (46%) than trust it (33%).
Source: KPMG & University of Melbourne, April 2025
View as table
| Measure | Share of respondents |
|---|---|
| Use AI regularly | 66% |
| Relied on AI output without evaluating accuracy | 66% |
| Made mistakes at work due to AI | 56% |
| Willing to trust AI systems | 46% |
Read together, these numbers describe the design brief: people use AI heavily, do not fully trust it, and still skip verification. The job of the interface is to support calibrated trust - making it easy to see when an output is reliable, when it is uncertain, and how to check it - rather than simply making outputs look authoritative.
Settle the information architecture first
The most common mistake in data-heavy AI products is designing screens before deciding what belongs on them. Three questions sort almost everything:
- What does the user need to see first to make their next decision? This goes on the primary screen.
- What might they need, but only sometimes? This goes one step away - an expandable panel, a detail view, a tab.
- What do they almost never need during the core task? Configuration, advanced settings and raw logs belong in separate areas.
Practical rules that follow:
- Separate "what changed" from "everything that exists". Most users care about the former far more often.
- Default to summary views with a clear path to detail, not the reverse.
- Group configuration and advanced options away from the primary workflow rather than interleaving them.
- Keep the same object (a document, a case, a record) in the same place across views, so users build a mental map.
Progressive disclosure is the core pattern
Progressive disclosure - a simplified default view with user-controlled access to more detail - works especially well in AI products because data volume is structurally high. Trying to solve density purely through visual design (smaller text, tighter spacing, more columns) treats a structural problem as a styling one, and it breaks as soon as the product adds more data.
| Layer | What it shows | Example in an AI analysis tool |
|---|---|---|
| Glance | The answer and whether it needs attention | "3 contracts flagged for renewal risk" |
| Explain | Why the system thinks so | Key clauses highlighted, the factors behind each flag |
| Verify | Evidence and sources | Links to the exact passages; model and data version |
| Configure | How the analysis works | Thresholds, rules, which documents are included |
| Audit | What happened and who did what | History of changes, overrides and approvals |
Each layer is one deliberate action away from the previous one. Users who only need the glance never see the rest; users who must verify can get there quickly.
Patterns for trustworthy AI output
- Show provenance. Link claims to the source passage, record or dataset. "Based on 12 documents" should open those 12 documents.
- Communicate uncertainty honestly. Use plain categories ("high / medium / low confidence") with an explanation, rather than false precision like "87.3%" that users cannot interpret.
- Make verification cheap. Put the check next to the claim - a side-by-side source view, a highlight in the original document.
- Keep humans in control. Clear accept, edit and reject actions for suggestions; never apply consequential changes silently.
- Design the loading and streaming states. Long-running analysis needs progress, partial results and a way to cancel.
- Design failure states. Say what the system could not do, why, and what the user can try next.
- Label AI-generated content so users know what was produced by a model and what was entered by a person.
Data visualisation needs its own colour rules
Charts have different requirements from brand colour. They must be distinguishable at a glance, often side by side, and readable by people with colour-vision deficiency. WCAG asks for 3:1 contrast for graphical objects needed to understand content, and meaning should never depend on colour alone.
That is why a dedicated utility colour layer, separate from the brand's accent colours, matters. On the AI brand project I worked on, the colour system was rebuilt with a distinct utility layer for charts and data, tested alongside the foundation, structural and interactive layers - see the WCAG contrast testing walkthrough. Practical chart rules:
- One accent colour to highlight what matters; neutral tones for context.
- Direct labels on key values instead of forcing legend look-ups.
- A table view for every chart, for accessibility and for users who want exact numbers.
- Consistent colour for the same entity across every chart in the product.
Tables, filters and density
Professional users often prefer dense views - if they are well organised. Give them control rather than choosing for them:
- Density options (comfortable and compact) remembered per user.
- Column choosers and saved views for recurring tasks.
- Sticky headers, frozen identifier columns and right-aligned numbers.
- Filters that show what is applied and can be cleared in one action.
- Keyboard navigation for power users.
How to know it is working
- Time to answer a representative question using the product.
- Share of AI outputs users verify, edit or reject - and whether that matches actual accuracy.
- Support questions about "where do I find" or "what does this number mean".
- Usability test results for first-time and expert users separately.
Most requests I get for "cleaner" AI product interfaces are information architecture requests wearing a visual-design costume. Teams ask for less clutter, but the real fix is almost always deciding what does not need to be on screen by default - not making the same amount of information smaller and denser.
On AI enterprise work, applying the brand and design system consistently across real product screens, not just the marketing site, was where governance paid off. A well-organised information hierarchy, expressed through a consistent, tested UI system, is what makes a data-heavy product feel confident rather than overwhelming.
Frequently asked questions
Should we show confidence scores to users?
Show confidence in a form users can act on - plain categories with a short explanation and a way to verify. Raw percentages often create false precision and are misread.
How do we explain AI outputs without overwhelming users?
Layer it: the answer first, then a short "why", then evidence on demand. Most users will stop at the first or second layer; experts can go deeper.
Is progressive disclosure bad for power users?
Not if it is designed well. Remember user preferences, offer keyboard shortcuts and saved views, and let experts pin the detail they always want visible.
How should AI interfaces handle errors?
Say plainly what failed, whether any partial result can be trusted, and what the user can do next. Avoid generic "something went wrong" messages in professional tools.
Do AI interfaces need a separate design system?
They need AI-specific patterns - streaming, confidence, provenance, feedback - but these should extend your existing design system rather than live in a separate one.
Product interface feeling overwhelming as it grows?
Let's rework the information architecture before adding more visual polish.
Sources
Every statistic in this article links to its original publisher. Figures were checked against these sources on September 29, 2026.
- Trust of AI remains a critical challenge - KPMG & University of Melbourne, April 2025
- Stack Overflow's 2025 Developer Survey - Stack Overflow, 2025
- Understanding SC 1.4.11: Non-text Contrast - W3C